
Financial Statement Analysis – Using lagging indicators (Part 1)
01 Jan, by
Author: Michael M Lee
1. INTRODUCTION
This article is the first of 5 parts which examine why traditional financial statement analysis (FSA) using ratios are lagging in the prediction, monitoring and control of the financial health of a company. It ends with how a systematic and integrated approach applying both lagging and leading indicators could proactively satisfy those objectives.
This article is written with the non-accounting & finance professionals in mind.
2. THE ECONOMIC RESOURCES APPROACH TO ACCOUNTING (ERAA)
Before we embark on FSA, I would like to introduce the economic resources approach to accounting (ERAA) diagram which I have designed to better explain and understand accounting & finance.
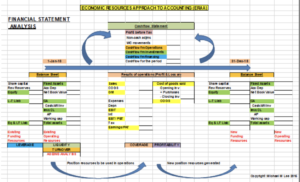

A company starts with funding both from the shareholders and the third-party lenders, typically banks. These funding resources (left hand side of Balance Sheet) are capital employed in the business to acquire operating resources (right hand side of Balance Sheet). Inventory is then placed out to sell at a profit and cash is collected or accounts receivables created. These are later collected, turned into cash, bought inventory again, sold inventory, and the cycle continues day by day. At the end of the period/year, the results from operations are captured in the “profit after tax” (PAT) line. PAT is added to revenue reserves as new funding resources for the next period of operations.
Funding resources therefore come from 3 sources
a) share capital – contribution by shareholders
b) retained earnings/revenue reserves – profits/losses accumulated from period to period.
a) and b) are collectively known as “shareholders’ equity” or simply “equity”, and
c) long term borrowings or debt.
Operating resources comprise
a) fixed assets
b) investments and
c) working capital: current assets (cash, accounts receivable and inventory) less current liabilities (accounts payable and other liabilities).
3. CRITICAL AREAS IN THE ERAA DIAGRAM
Besides showing the flow of transactions from funding resources to retained earnings, this diagram also encapsulates 3 other areas that are critical to a fuller understanding of accounting & finance, and briefly, they are:
3.1 Flow of cash
- Changes in cash balance from beginning to end of period. This is where a Cashflow Statement has to be prepared to show the flow of cash between the 2 points in time. Cashflow activities that affect Cashflow position are operating, investment and financing activities.
3.2 Impact of funding & operating resources on performance
- The impact of capital structure (debt and equity) from the use of debt/leverage on Profit & Loss a/c via interest expense.
- The impact of depreciation of fixed assets and incurred expenses on P&L
3.3 Growth & shareholder value creation
- The total cost of capital employed in the business is the cost of equity and cost of debt. The average cost of capital (equity and debt) weighted by their respective proportions is known as WACC or weighted average cost of capital. If WACC is say, 9%, it means that the operating resources are acquired at an average of 9%. Therefore, when we use cash (an operating resource) to acquire a project, the project must return a profit of at least 9% on cost of investment; otherwise there will be an erosion of shareholder value. In other words, we are using funding resources at 9% to acquire an investment which gives us a return (profit) of less than 9%. The WACC is therefore the “hurdle rate” (the minimum acceptable return) to qualify investment acquisition or participation.
The above will be explained in further details in my other future articles.
4. TRADITIONAL FSA
Traditional FSA uses financial ratios to gain an insight on what have gone wrong and what are doing well. Unfortunately, they are based on historical figures.
Ratios express a relationship between 2 variables to form an assessment of their results. A financial ratio
a) has a numerator and a denominator and both numerator and denominator must “jive”.
b) can be explained as $1 of denominator supporting (or covering) $x of numerator.
For a higher ratio, we need to either
i) increase the numerator or decrease the denominator
ii) increase numerator more than the increase in the denominator or
iii) decrease numerator less than the decrease in the denominator.
Knowing these relationships will enable the accountant to orchestrate some desired results.
The key groups of financial ratios are:
-
- Liquidity
- Turnover
- Profitability
- Leverage and
- Coverage ratios
4.1 Liquidity ratios
They are current ratio (current assets/current liabilities) and quick ratio (current assets less inventory/ current liabilities). They indicate how much current asset dollars can cover $1 of current liability. Typically, it should be about 1.2 to 1.5 times, depending on industry characteristics. A higher ratio may mean that current assets are excessive and so we will have to examine the next ratio, turnover ratio, for enlightenment.
4.2 Turnover ratios
These are accounts receivables turnover (average accounts receivables/average daily credit sales) inventory turnover (cost of goods sold/average inventory) and accounts payable turnover (average accounts payable/ average daily cost of goods sold) ratios. They indicate how fast these current assets roll and how fast the payables are settled. The faster the asset turnover the better. Any slowdown in turnover may indicate impairment. So we will need to drill down to the next level, which is ageing of receivables and inventory to assess the extent of likely impairment.
4.3. Profitability ratios
These are
- operating profit margin (OPM)
- net profit margin (NPM)
- return on assets (ROA)
- return on equity (ROE)
OPM is a measure of the efficiency and effectiveness of operations while NPM measures efficiency and effectiveness of both operations and treasury function.
ROA (PAT/Total assets) indicates the efficiency of the use of total assets for generating sales and operations. This ratio can be decomposed into PAT/Sales X Sales/Total assets or NPM X Total assets turnover. By analysing the composite ratios, we gain a better understanding of which department (management of operations/P&L or management of total assets) caused the problems.
Unfortunately, ROA does not satisfy shareholders’ and other stakeholders’ requirements ie to what extent is debt or leverage used to generate more operating resources for greater performance. This is where ROE (PAT/ equity) which indicates the return from the use of equity to generate profits. More profits will be generated with effective use of leverage (or debt). The decomposition of ROE (PAT/Total assets X Total assets/ equity or ROA X leverage) provides a clear picture of extent of debt usage. ROE therefore has to be at least equal to ROA (if no debt is used) or greater than ROA (depending on extent of debt usage).
4.4. Leverage ratio
Leverage ratio (debt/equity) indicates the proportion of debt vis-à-vis equity. It is defined in various ways depending on what is being emphasized (the denominator factor). Interest arises from the use of debt and so the higher the leverage the higher the debt and consequently the higher the potential financial risk. The proportion of debt and equity constitutes capital structure and the key question is whether there is an optimal capital structure to avert unnecessary financial risk. This question will be discussed in my later article.
4.5 Coverage ratios
Coverage ratio (EBIT/ interest) indicates the extent of debt interest coverage by EBIT (interest before interest & tax). It is also a measure of financial risk. If the coverage ratio is lower than industry’s, then there is financial risk and the company needs either to cut back on debt or increase EBIT through increase in sales and/or decrease in costs and expenses.
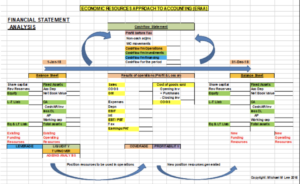
5. HOW TO PERFORM FSA SYSTEMATICALLY ?
One approach is to follow the flow of transactions in the ERAA diagram, as shown. Starting from the left-hand side of the Balance Sheet, apply leverage ratio to assess the extent of use of debt and the consequential financial risk level. Then proceed to the right-hand side of the Balance Sheet to assess liquidity. Finally assess profitability with the OPM, NPM, ROA, ROE, and coverage ratios.

6. DRAWBACKS OF TRADITIONAL FINANCIAL STATEMENT ANALYSIS (FSA)
6.1 It uses historical data which are after-the-fact. The analysis only points to what has gone wrong (not what will go wrong) and management will have to rectify the problems.
6.2 The company tends to drift along quarter by quarter rather than driving the business not only from operating performance but also from financial risk perspectives.
6.3 FSA does not answer the following questions
- Is the company expanding beyond its financial limits, which may lead to subsequent weak or poor operating performance?
- Are there growing signs of a slowdown in the economy or industry? How do we gauge that impending onset and be prepared for it?
- Is there a concentration risk in major product categories or geographic regions?
- Are too much resources applied to certain sectors of the businesses?
- Is there an optimal capital structure to grow the business?
7. WHAT NEEDS TO BE DONE?
To ensure the company’s financial health into the future, we shall need indicators that are leading …. leading the way to predict, prevent and protect the business and financial risks of the company.
Two useful leading indicators are
- Financial limits to growth (FLTG)
- Two-level sales analysis (TLSA)
Given the current operating characteristics and financial policies of the company, we would be able to predict the sustainable level of sales/revenue growth in the following year and into the future. The FLTG formula provides us with the sustainable sales growth rate and if we exceed that rate without proper funding, liquidity weakens, and the company’s financial health becomes an issue.
The TLSA applies segment information at 2 levels viz, trend and segment. It provides signs when an industry or the economy is slowing down and/or when there is product or geographic concentration risks, among other useful indications.
8. CONCLUSION
In Part 2 of this series, I shall discuss in some detail the FLTG and TLSA indicators and how they are to be applied in conjunction with traditional financial statement analysis to provide an integrated and wholesome financial analysis of a company’s health.
——————————-MMLee 26th Nov 2018—————————-
